Housing Market Update
Real Data Analyzed
By Cyrus Bonnet

As I predicted in March the intense bidding wars of April will move to mid – late May. and this has been occurring last few weeks. Yes the furry of previous sellers markets have returned. We certainly are experiencing over asking price, waived contingencies, Money on low appraisal and days on Market have came down greatly.
However, as of today I would take that with some skepticism until the end of June when we can see if sellers turn out to supply the markets as they usually do in July – Sep. The most obvious factor is this is a very normal occurrence in the spring since we started a sellers market in March 2015 for bidding wars to occur in mass.
It’s hard to tell if sellers are going to flood the market and take hold of their equities, or hold on to their properties for a bit longer with lower interest rates.
Another factor are interest rates. Buyers are slowly starting to accept interest rates where they have lingered for the past few quarters in the 5.5-7% depending on loan type. but recently rate went up again just as the market was getting momentum. I feel this will cause buyers to come off the gas some: but hen again more inventory may continue to peek their interest.
At ground level we are still seeing over priced homes still sit and offers a great opportunity to get incentives for buyers like rate buy downs, closing costs paid, etc. Properly priced homes for their condition location and such are getting a lot of attention from buyers. and these are the homes boasting the uptick in bidding wars.
Covid put a wrench in historic trends and now with inflation and interest rates we are sill in unknown trajectories. We are still short millions of housing but there has been a huge uptick in multifamily units to absorb some of that and builders are back building with costs of material down labor up.
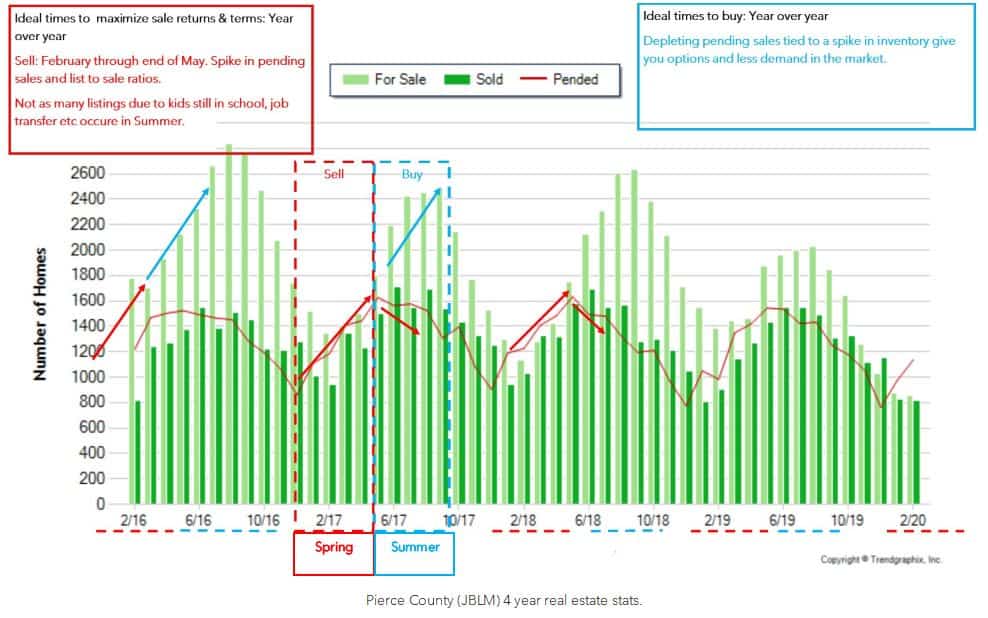
Here is a chart I created for reference on historics on best time to buy and sell a home. if you remove 2021-2022 it would represent a more consistent flow. But now we are dealing with uncertainties in many sectors, not a virus but inflation, high interest rates, affordability issues and lack of inventory as we are still short millions of needed homes new, resale and rentals.
Online Valuation Models’ (Zestimate, redfin estimates etc) OVM’s

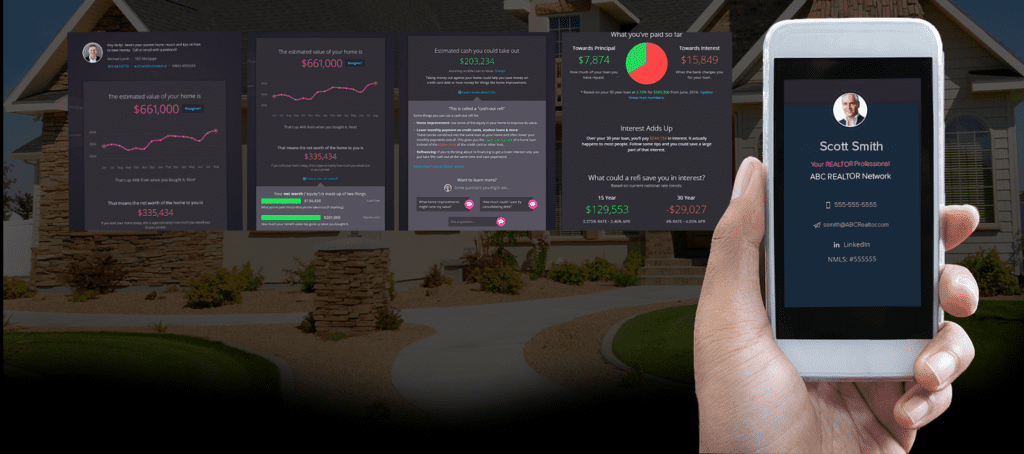
Online valuation models such as zestimates from Zillow, realtor.com home estimates and redfin estimates are quite a bit off right now as they are unable to adjust accordingly as a markets keep shifting back and forth from covid to the last 8 months to the Market of today. I’ve seen them with over $100,000 spread. and even Redfin is giving yo u100k swings on its site. Many of them cant find proper comparable homes so they use random homes that have absolutely no comparison. Both buyers and sellers be weary when looking at online estimates of homes. Be sure to look at the top three competitors to see your spread amongst the three, and most importantly contact us for a true evaluation of the property. This site below is something i pay for you to use for free. Its also not as accurate but lets you adjust it and gives you many more tools.
Find your homes
Online value, Appreciation, Payoffs calculators, Rental & Airbnb Value, and much more here on Homebot!
The Local Data
Pierce, Thurston, Kitsap Counties

Both active and Pending sales are up, traditionally pending’s start to tapper off end of month while active and new home continue to rise. The delay in spring season wont allow us to see for a few weeks how the summer inventory will go. It will go up, its just a matter of how much.
May 2022 vs 2023 Pending sales
Pierce
1,2962022| -17.6%
Thurston
467 | -14.9%Kitsap
442 | -15.2%
May 2022 vs 2023 Homes for sale
Annually down monthly up (-Kitsap)
Pierce
1,640 | -15.4%Thurston
533 | -9.0%Kitsap
711 | +12.5%
May 2022 vs 2023 Days on Market
Though from this time last year its way higher % wise, compared to 3 months prior we were averaging 34 so we are way down and back to norms. and still remain in a sellers Market
Pierce
7 | +40.0%Thurston
7 | +40.0%Kitsap
11 | +83.3%
May 2022 Vs 2023 List Price to Sale Price Ratio
List price to sales price ratio is if a home sells for more or less then list price. 100% means it sold at list price.
Example: If a home is listed at $500k
A 105% list to sale ratio is +5% over so $25,000 over = $525,000.
A 95% or -5% list to sale ratio would equal $475,000
Pierce
98.9% | -4.7% |Thurston
99.6% | -4.1%Kitsap
98.2% | -6.4%
May 2022 Vs 2023 Average Sales Price
Pierce
$569,594 | -6.8%Thurston
$526,199 | -2.9%Kitsap
$664,481 | +5.7%
Mortgage Rates Update +-
Rates unfortunanly have been on the rise the last few weeks.
Expert predications on Interest Rates – Bankrate

Mouse over and click Interactive chart for today & past rates (Turn phones sideways)
News
Where are people buying Homes
Top markets at Risk of Decline
Most and fewest homes for sale right now in the nation
Existing homes sales snap shot nationally
Buyers overall you should not be waiting to get your pre-approvals done in the event we do get a surge of listings and or rates take a big dip you’re able to jump on a property that actually fits your criteria that you aren’t settling on. Scrambling last minute always loses you the deal. plus there may be many homes overpriced we can get the seller to pay closing costs, rates buy downs or both!! Be sure to connect with one of our top lenders to get started with for the best interest rates, advice, and lowest fees. We have spent years developing relationships with leading mortgage brokers. Visit our lender page Here
As I mentioned in previous updates it’s better to take a high rate now with the intent of refinancing when rates come down think it’s stuck in the intense bidding wars of covid or springtime. You should have a little bit more of an upper hand the next two months if inventory picks up. We have some of the best winning strategies to win in bidding wars. We were able to even negotiate rate by Downs to 3.75% recently paid by the seller.

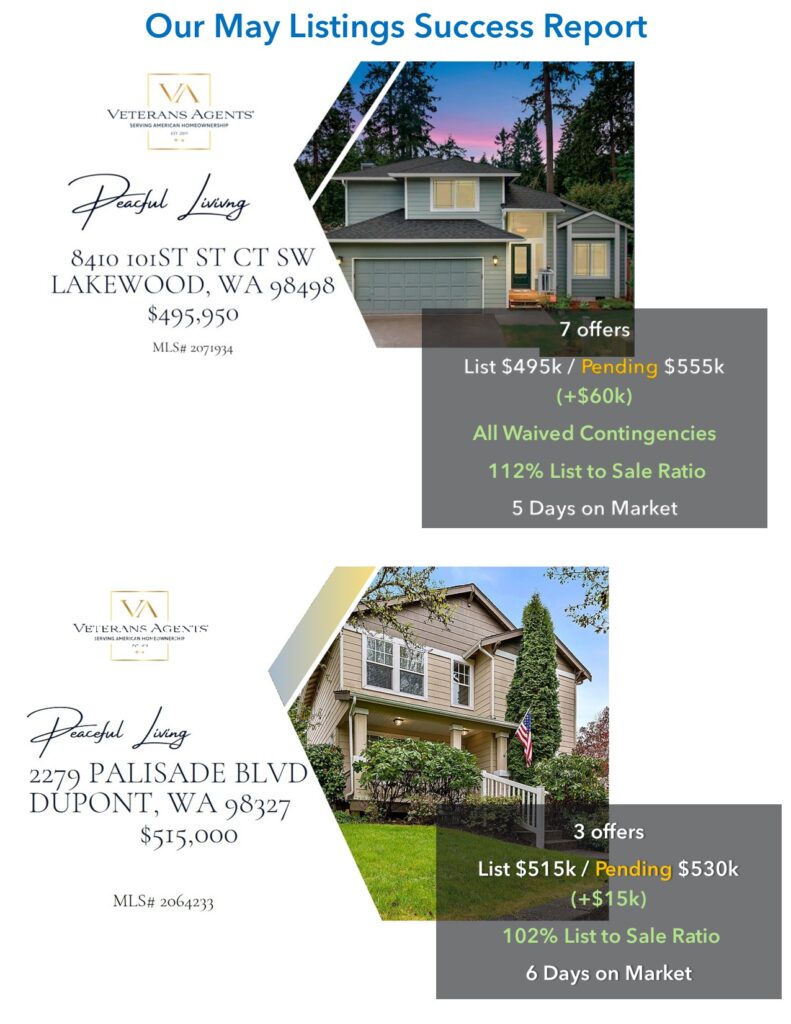
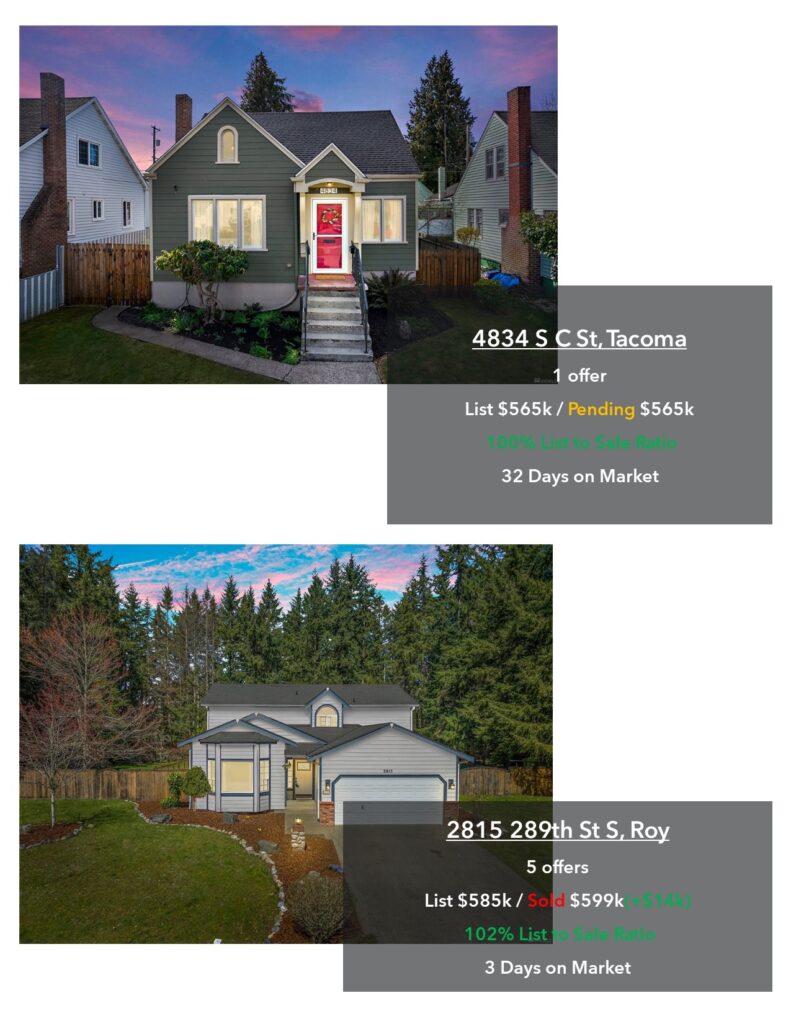
Sellers, it is still a seller’s market and you’re still ahead of any curve ball that may be thrown at us as of today. we are approaching a neutral market for peak innvety months so be sure price properly and get your home ready properly for marketing. We have had huge success with our 4 may listings (see below) If you want to know what your home is actually worth not just online values or what we do to help you get your home sold please contact us anytime. we have had tremendous success with marketing our listings these last few months nearly all over asking low days on Market, Etc. We are able to properly guide you in pricing and strategies on how to hit the market. See below our results for this month of May. We have a free service below called home bought that tracks your home value mortgages rental rates and more be sure to sign up.
We have a proven background, verifiable reviews, 13 years experience and much more. We are ready to get started working for you for success just as we have with our past clients.
Cyrus & Jenna
Connect with us
253-766-5133


